By 2022, most major cities have placed sustainability at the forefront of their agendas. However, we aimed to identify which US cities are leading the way in making significant progress toward becoming more environmentally friendly.
For this study, we looked at large US cities with a population greater than 500,000 people and tried to cover as many data points as possible and score them accordingly.
Some of the ranking factors include the following:
- Green spaces per capita
- Air quality index
- Green energy usage
- Recycling rate
- Public transport
- Walkability
You can access the full data set here.
“Green cities” are typically those cities that promote and engage residents in sustainable habits to preserve the city’s environment. However, not all cities have put the same amount of effort into maintaining sustainability in city life.
Green programs like ensuring waste recycling1 and promoting renewable energy sources improve the environment, ensure good public health conditions, and create more job opportunities.
What we cover
ToggleHow to read the data and ranking scores
In some cases, a higher score is best such as green spaces per capita and Recycling rate, but for other ranking factors such as Waste generation and Air quality index a lower score will be better.
See below for an outline of each ranking factor.
City Rankings
| Rank | City | Index score | Environment rank | Energy and resource efficiency rank | Transport rank |
|---|---|---|---|---|---|
| 1 | Seattle | 100 | 19 | 1 | 5 |
| 2 | Portland | 96.10 | 2 | 14 | 7 |
| 3 | Philadelphia | 95.62 | 3 | 12 | 6 |
| 4 | San Francisco | 95.37 | 20 | 3 | 1 |
| 5 | Houston | 85.88 | 1 | 4 | 17 |
| 6 | Boston | 80.53 | 8 | 26 | 4 |
| 7 | New York | 80.04 | 22 | 19 | 2 |
| 8 | Phoenix | 75.18 | 9 | 5 | 21 |
| 9 | Sacramento | 74.69 | 19 | 8 | 14 |
| 10 | Los Angeles | 74.20 | 24 | 11 | 9 |
| 11 | Austin | 70.80 | 11 | 7 | 23 |
| 12 | Chicago | 69.83 | 7 | 34 | 3 |
| 13 | Baltimore | 69.70 | 13 | 21 | 12 |
| 14 | Denver | 68.36 | 32 | 9 | 8 |
| 15 | San Jose | 66.90 | 36 | 2 | 11 |
| 16 | Washington | 66.42 | 23 | 16 | 13 |
| 17 | Milwaukee | 63.01 | 10 | 31 | 10 |
| 18 | Detroit | 61.55 | 15 | 23 | 15 |
| 19 | San Diego | 60.09 | 30 | 6 | 18 |
| 20 | Tucson | 59.61 | 27 | 17 | 16 |
| 21 | Mesa | 56.93 | 18 | 15 | 25 |
| 22 | San Antonio | 52.79 | 6 | 24 | 27 |
| 23 | Charlotte | 52.55 | 5 | 10 | 34 |
| 24 | Fresno | 50.36 | 34 | 13 | 20 |
| 25 | Dallas | 48.41 | 29 | 20 | 19 |
| 26 | Las Vegas | 47.79 | 12 | 33 | 24 |
| 27 | Memphis | 43.55 | 4 | 25 | 32 |
| 28 | Kansas City | 39.17 | 21 | 18 | 33 |
| 29 | Columbus | 35.76 | 14 | 36 | 26 |
| 30 | Albuquerque | 35.52 | 33 | 30 | 22 |
| 31 | Nashville | 28.22 | 17 | 28 | 37 |
| 32 | Indianapolis | 24.33 | 28 | 27 | 30 |
| 33 | El Paso | 24.08 | 26 | 35 | 28 |
| 34 | Jacksonville | 23.11 | 25 | 29 | 36 |
| 35 | Oklahoma City | 18.73 | 35 | 22 | 35 |
| 36 | Louisville | 9.00 | 31 | 37 | 29 |
| 37 | Fort Worth | 5 | 37 | 32 | 31 |
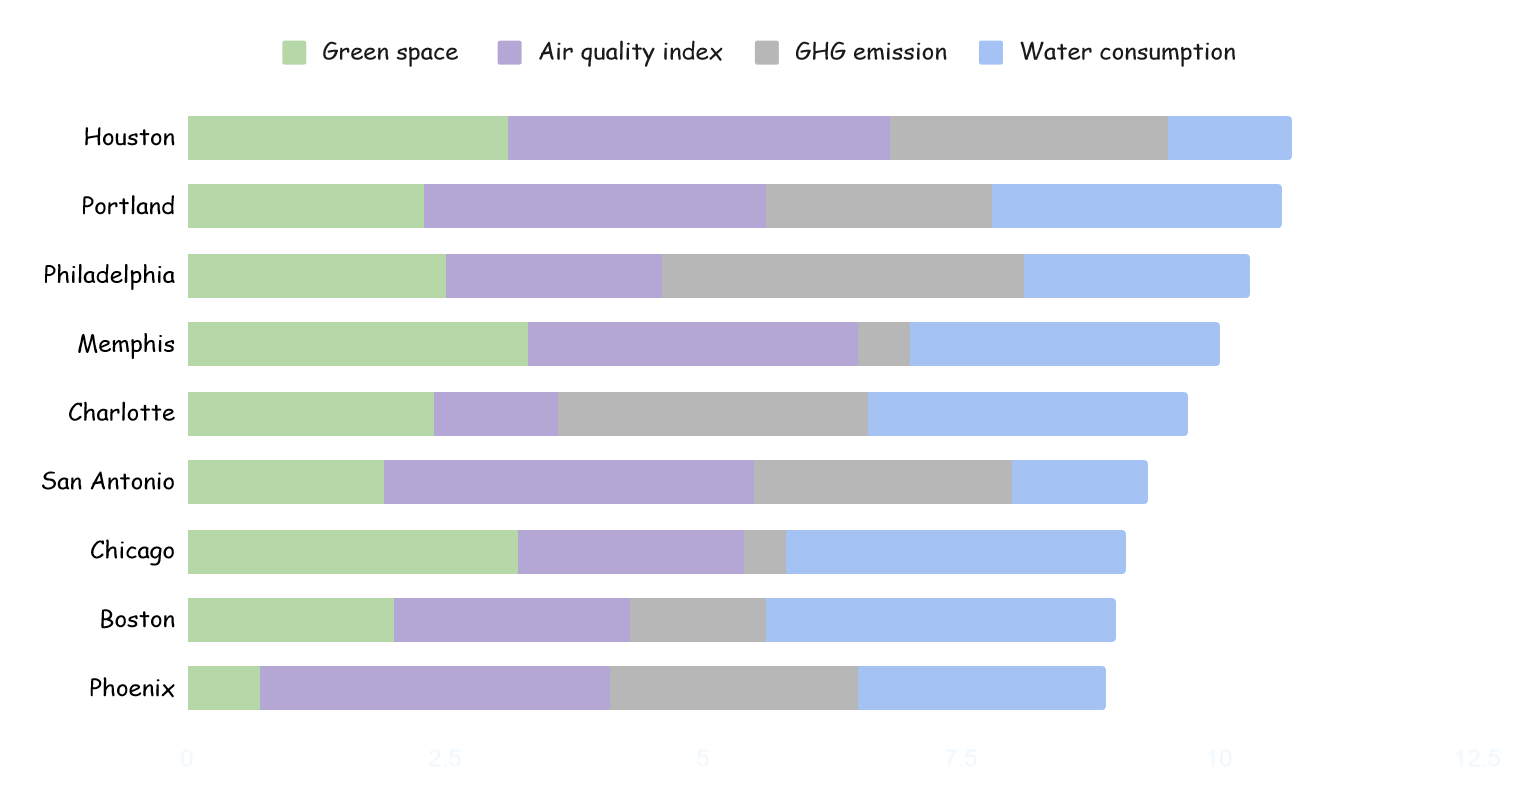
Recognizing the benefits of green practices, US cities elevated their sustainability approaches and obtained economic gain. Moreover, a survey suggested that 66% of US citizens agreed that we should conserve our environment2 for future generations. About half of the population think the cost of putting strict measures such as laws and fees is justified. We believe a careful empirical study is important to reveal how cities’ sustainability efforts across the US vary regarding preserving the cities’ nature and the well-being of the residents. To determine that, we compared the 37 most populated cities using ten critical matrices divided into three categories, i.e., environment, energy, resource efficiency, and transportation.
Methodology and metrics
To determine the greenest cities in the US for 2022 top 37 cities based on their population were selected. Ten crucial indicators in three categories (i.e., environment, resource and energy efficiency, and transport) were carefully picked to ascertain the greenest city3 in the US holistically. All the ten variables were weighted and assessed on a scale of 100 to characterize cities with the greenest practices and living conditions.
Finally, indicator scores were summed and normalized to 100, where 100 represented the greenest of all cities in the US.
| Category | Variable | Best |
|---|---|---|
| Environment | Greenspace | Higher is better |
| Air quality index | Lower is better | |
| GHG emission | Lower is better | |
| Water consumption | Lower is better | |
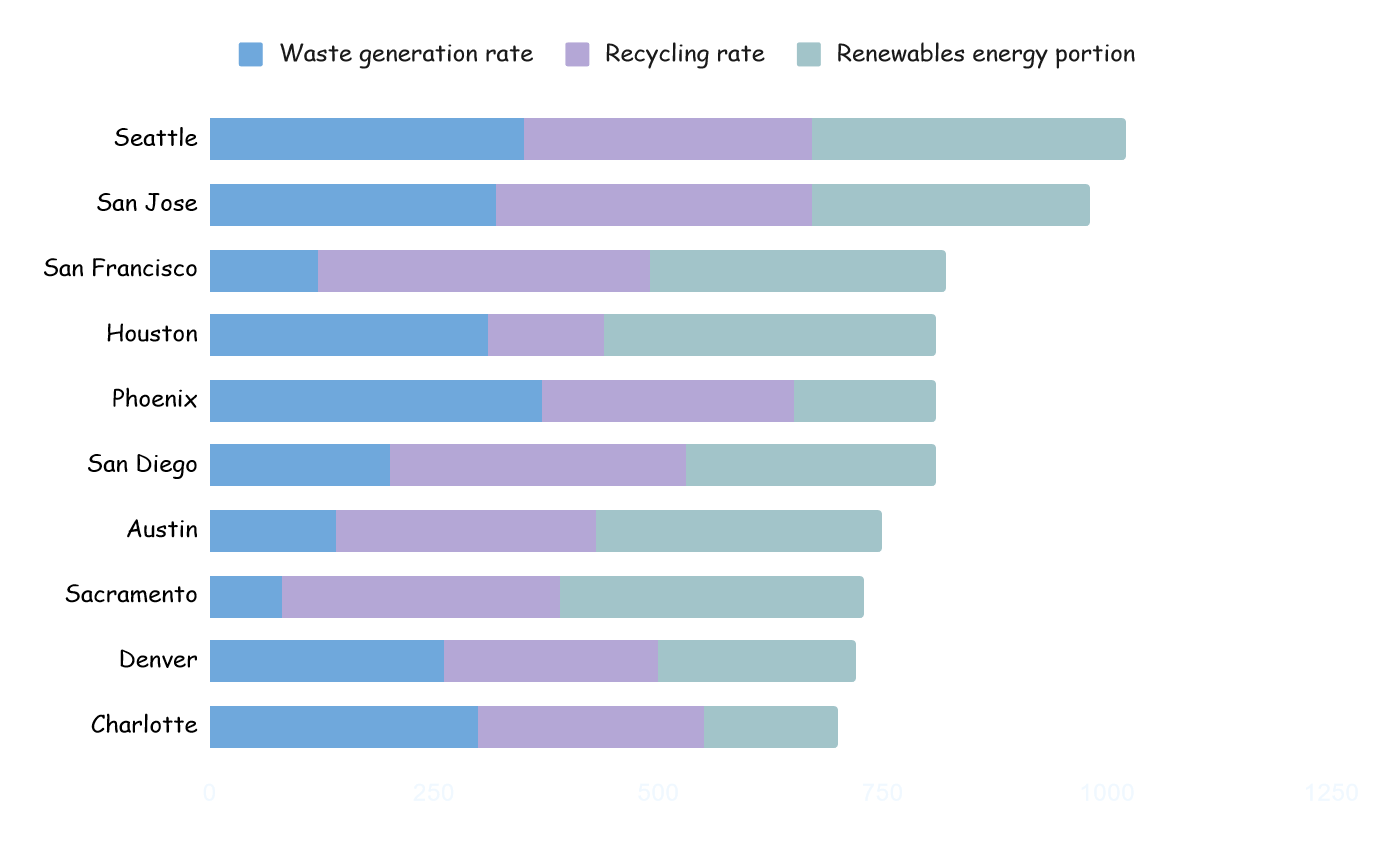
| Energy and resource efficiency | Waste generation rate | Lower is better |
| Recycling rate | Higher is better | |
| Renewables energy portion | Higher is better | |
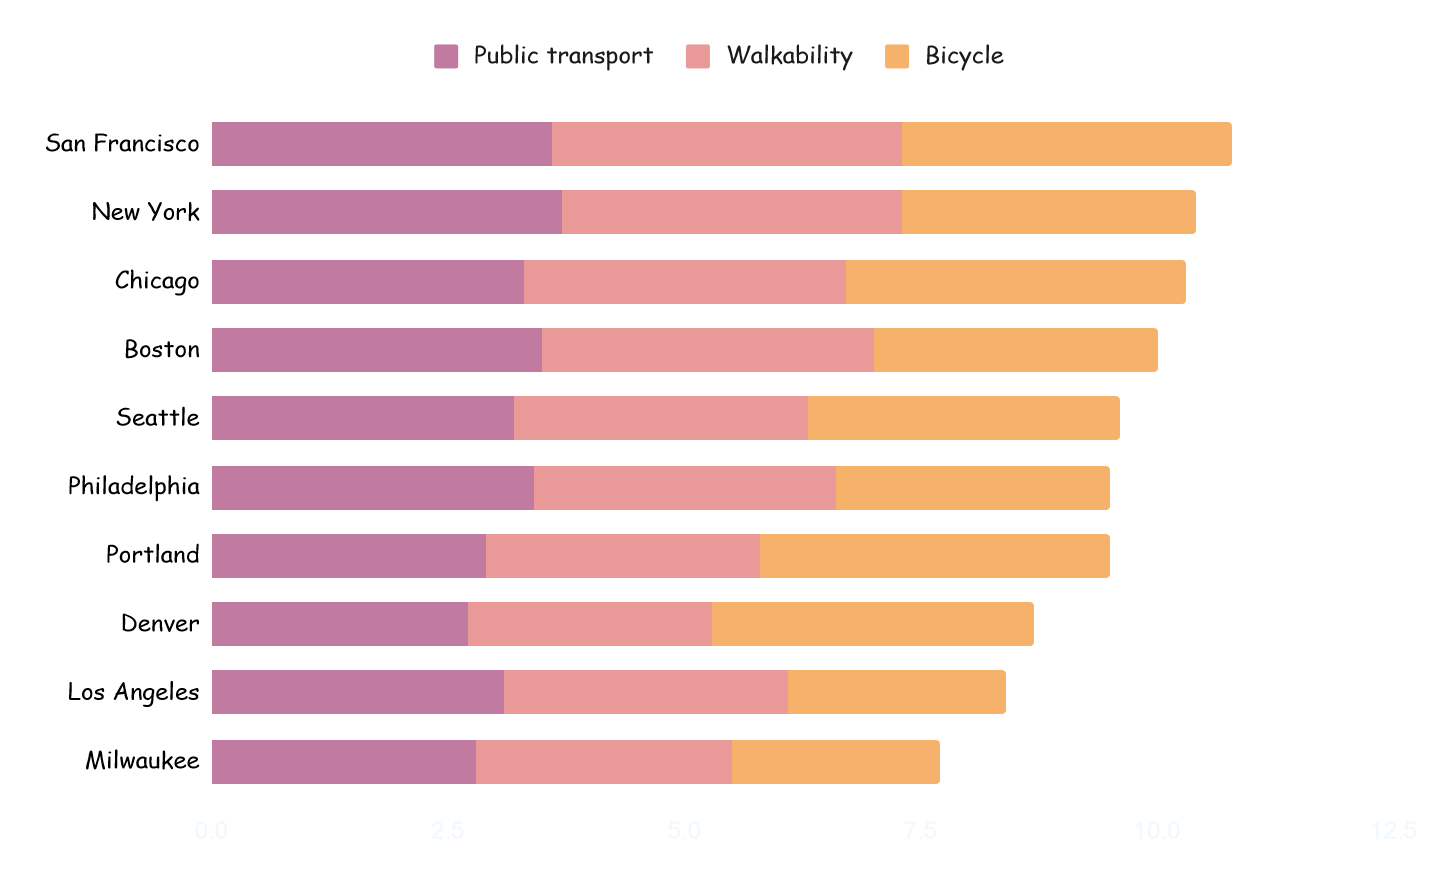
| Transport | Public transport | Higher is better |
| Walkability | Higher is better | |
| Bicycle | Higher is better |
Top five green cities in the USA
#1 Seattle
- Environment #19
- Energy and resource efficiency #1
- Transport #5
This is no surprise that Seattle ranks first in sustainability with parks and forests all around the city. Seattle has the lowest air conditioner4 usage in the entire USA and a high standard of public transportation. Privately owned cars must pass regular emission checks to reduce the city’s greenhouse gas emissions and maintain air quality. The city of Seattle has the highest number of LEED energy-efficient certified buildings.
#2 Portland
- Environment #2
- Energy and resource efficiency #14
- Transport #7
Apart from the fact that citizens of Portland agreed to increase their tax to conserve the city’s natural assets, Portland holds the second position for a range of reasons. Portland was the first city in the US to finalize a bicycle master plan in 1970. About 50% of the total energy consumption comes from renewable sources.
#3 Philadelphia
- Environment #3
- Energy and resource efficiency #12
- Transport #6
Philadelphia, once an industrial hub, is one of the first cities to mandate building owners to report energy usage and promote investment in resource efficiency. The city developed a robust stormwater management system with rain gardens and stormwater planters. Philadelphia has 13% of its land as parkland, making it one of the top cities in the US with per capita canopy covers.
#4 San Francisco
- Environment #20
- Energy and resource efficiency #3
- Transport #1
San Francisco has long been practicing sustainability and is recorded to have the most recycling capacity (i.e., 77%) in the whole US. On top of that, this city has the best transportation system, and about 66% of the vehicles in the city run on alternative fuels resulting in lower dependency on conventional fuels.
#5 Houston
- Environment #1
- Energy and resource efficiency #4
- Transport #17
Huston is showing commitment to the Paris Agreement and highly investing in renewables as energy sources to reduce greenhouse gas emissions and improve air quality. Houston municipality is the top in the US as a user of renewables for its energy source.
Ranking Factors
Environment
Environmental rank considers % of the green quality of living, per capita greenhouse gas emission, and consumption of water. These are all indicators of the quality of the environment. Houston held the top position in the environment rank, while Fort Worth was dead last.

Energy and resource efficiency
Some cities are doing an excellent job managing waste, creating an economy from recycling goods, and adopting renewables as a source of energy. Seattle was a pinnacle for many US cities regarding energy and resource efficiency.

Transportation
To have a better public transport facility, ensuring city-wide walkability and bicycle ways is a measure of sustainability for the city’s transportation sector. San Francisco held the top position in our transportation rank and found Nashville to be less attractive for public transportation.

- United States Environmental Protection Agency, (2023) Recycling Basics and Benefits. <https://www.epa.gov/recycle/recycling-basics-and-benefits> Accessed: 18-03-2024
- Gallup, (2024) Environment. <https://news.gallup.com/poll/1615/environment.aspx> Accessed: 18-03-2024
- Sandra Ropero Portilo, (2023) What Is a Green City? – Sustainable Cities Definition. <https://www.thedailyeco.com/what-is-a-green-city-sustainable-cities-definition-406.html> Accessed: 18-03-2024
- U.S. Energy Information Administration, (2011) Residential Energy Consumption Survey (RECS). <https://www.eia.gov/consumption/residential/reports/2009/air-conditioning.php> Accessed: 18-03-2024


